US Government Funding Roundabout
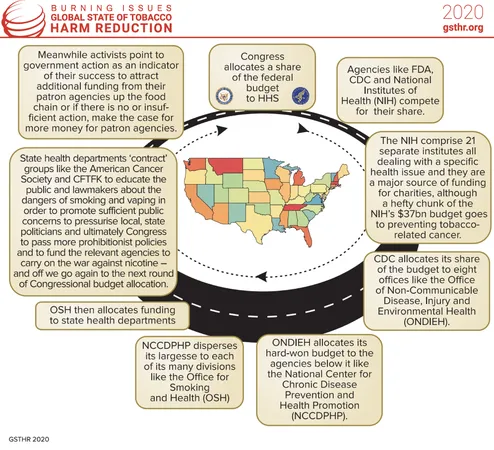
The US Government relies on a complicated cascade of financial assistance for its various departments. Money flows downwards from the Department of Health and Human Services (HHS), who …

In the United States, regulations around e-cigarettes vary by state. Generally, based on federal laws, these products are allowed and regulated as tobacco products. Regulations include requirements for child-resistant and tamperproof containers, and health warnings on packaging. All e-cigarette packaging must display the statement: “WARNING: This product contains nicotine. Nicotine is an addictive chemical.” There is no federal minimum age restriction on sales, although many states set their own age limits, typically 21 years.
Statistics show that vaping is widespread in the United States. As of 2020, there were an estimated 9.1 million current vapers in the country. The adult current vaping prevalence was estimated to be 6.9% as of 2024, and this prevalence was 9% among women and 10.4% among men as of 2023. Around 4.3 million people were daily vapers as of 2020, and the adult daily vaping prevalence was reported to be 1.33%. Daily vaping prevalence was slightly higher among adult men with 1.74% compared to among adult women with 0.99%. Overall, 17% of people in the U.S. reported having ever tried an e-cigarette in 2020. Public perception of harm by e-cigarettes varies — in 2017, 36.4% of adults believed e-cigarettes were equally as harmful as conventional cigarettes, 33.9% considered them less harmful, 4.3% viewed them as more harmful, and 25.3% had no idea about them.
| Year | Value | Reference/Comment |
|---|---|---|
| 2014 | 3.7% | 2A A |
| 2015 | 3.2% | 2A A |
| 2016 | 3.2% | 2A A |
| 2017 | 2.8% | 2A A |
| 2017 | 3.2% | 2B |
| 2018 | 3.2% | 2A A |
| 2019 | 4.5% | 2A A |
| 2019 | 4.45% | 2C |
| 2020 | 5% | 2D |
| 2020 | 3.7% | 2E B |
| 2020 | 3.7% | 2A A |
| 2020 | 3.7% | 2F C |
| 2020 | 3.7% | 2G |
| 2021 | 4.5% | 2A A |
| 2021 | 4.53% | 2H |
| 2021 | 4.5% | 2I |
| 2022 | 6% | 2A A |
| 2022 | 6.02% | 2J |
| 2023 | 9.6% | 2K |
| 2023 | 6.5% | 2L A |
| 2023 | 6.54% | 2M |
| 2024 | 6.9% | 2N A |
| 2024 | 7.01% | 2O |
| 2025 | 6.64% | 2P |
| Year | Value | Reference/Comment |
|---|---|---|
| 2019 | 3.51% | 2A |
| 2020 | 2.8% | 2B A |
| 2020 | 2.77% | 2C B |
| 2020 | 2.82% | 2D |
| 2021 | 4% | 2E |
| 2021 | 3.97% | 2F |
| 2022 | 5.2% | 2G |
| 2023 | 9% | 2H |
| 2023 | 5.47% | 2I |
| 2024 | 6.37% | 2J |
| 2025 | 5.76% | 2K |
| Year | Value | Reference/Comment |
|---|---|---|
| 2019 | 5.46% | 2A |
| 2020 | 4.6% | 2B A |
| 2020 | 4.55% | 2C B |
| 2020 | 4.64% | 2D |
| 2021 | 5.13% | 2E |
| 2021 | 5.1% | 2F |
| 2022 | 6.89% | 2G |
| 2023 | 10.4% | 2H |
| 2023 | 7.65% | 2I |
| 2024 | 7.7% | 2J |
| 2025 | 7.55% | 2K |
| Year | Value | Reference/Comment |
|---|---|---|
| 2019 | 2.11% | 3A |
| 2020 | 1.33% | 3B A |
| 2020 | 1.74% | 3C |
| 2021 | 2.19% | 3D |
| 2022 | 3.23% | 3E |
| 2023 | 3.44% | 3F |
| 2024 | 3.99% | 3G |
| 2025 | 3.78% | 3H |
| Year | Value | Reference/Comment |
|---|---|---|
| 2019 | 1.6% | 3A |
| 2020 | 0.99% | 3B A |
| 2020 | 1.31% | 3C |
| 2021 | 1.86% | 3D |
| 2022 | 2.67% | 3E |
| 2023 | 3.04% | 3F |
| 2024 | 3.74% | 3G |
| 2025 | 3.36% | 3H |
| Year | Value | Reference/Comment |
|---|---|---|
| 2019 | 2.66% | 3A |
| 2020 | 1.74% | 3B A |
| 2020 | 2.2% | 3C |
| 2021 | 2.54% | 3D |
| 2022 | 3.81% | 3E |
| 2023 | 3.85% | 3F |
| 2024 | 4.25% | 3G |
| 2025 | 4.2% | 3H |
| Year | Value | Reference/Comment |
|---|---|---|
| 2017 | 15.3% | 1A A |
| 2020 | 17.01% | 1B B |
| Year | Value | Reference/Comment |
|---|---|---|
| 2017 or earlier | Allowed | 1A |
| 2021 | Allowed | 1B |
| Year | Value | Reference/Comment |
|---|---|---|
| 2017 or earlier | Yes | 1A |
| 2021 | Yes | 1B |
The US Government relies on a complicated cascade of financial assistance for its various departments. Money flows downwards from the Department of Health and Human Services (HHS), who …
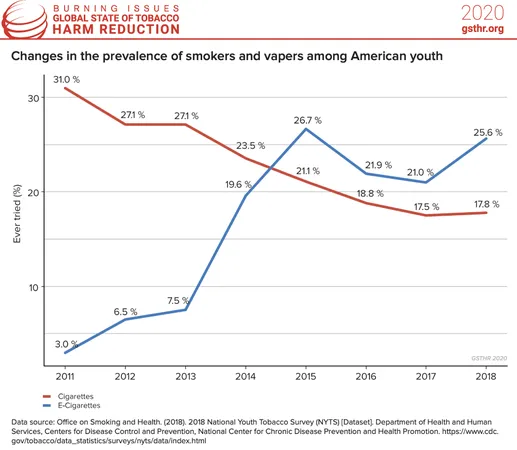
Cigarette smoking has been falling in the US for many years including among young people. When vaping products began to appear on the market, it was inevitable that …
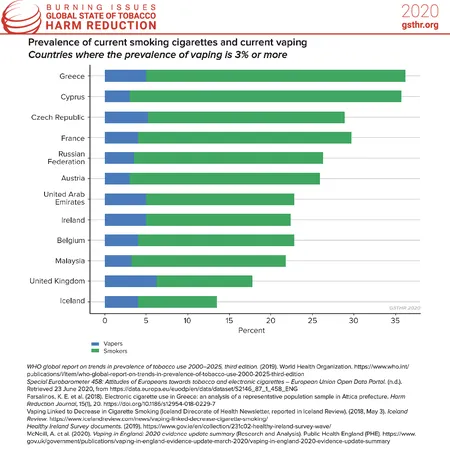
Overall, as a percentage of the total adult population, current use of vaping devices in different countries ranges between 1% and 7%. As shown by this graphic there …