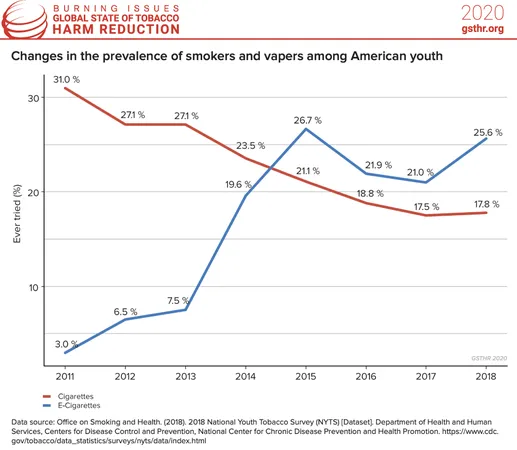
Changes in the Prevalence of Smokers and Vapers Among American Youth
Cigarette smoking has been falling in the US for many years including among young people. When vaping products began to appear on the market, it was inevitable that …

In the United States of America, smoking is allowed but tobacco products should follow some regulations. Under these regulations, health warnings on tobacco packaging including cigarettes are mandatory, the minimum legal age for their sales is 21 years, and there are no federal legal restrictions on smoking in public places. While tobacco advertising is regulated, not all forms of their advertising are banned. An excise tax of 32.16% with a total taxation rate of 37.36% is applied on cigarettes. Cigarettes can legally be sold with authorised documents. They may also be purchased through vending machines as well as through online channels. Importing cigarettes for trade is allowed with an appropriate import license.
Despite these control measures, prevalence data show that smoking remains an important public health issue in the United States. There were 39.8 million current smokers in the country in 2024. This represents an overall adult smoking prevalence of 14.1%, with higher prevalence among men (17.1%) than among women (11.1%). In comparison, the overall current smoking prevalence was 12.3% in 2022. The adult daily smoking prevalence was recorded to be 10.01% in 2020. Smoking-related mortality also remains significant in the country. In 2021, smoking resulted in 360,370 deaths, including 216,986 male deaths and 143,383 female deaths. This shows that smoking accounted for 10.38% of all deaths in the United States in 2021, with a higher rate among men (11.9%) than among women (8.7%).
| Year | Value | Reference/Comment |
|---|---|---|
| 2019 | 53.2 million | 1A |
| 2020 | 30.7 million | 1B A |
| 2024 | 39.8 million | 1C |
| Year | Value | Reference/Comment |
|---|---|---|
| 1999 | 23.5% | 1A A |
| 2000 | 23.3% | 1A A |
| 2001 | 22.8% | 1A A |
| 2002 | 22.5% | 1A A |
| 2003 | 21.6% | 1A A |
| 2004 | 20.9% | 1A A |
| 2005 | 20.9% | 1A A |
| 2006 | 20.6% | 1A A |
| 2007 | 19.8% | 1A A |
| 2008 | 20.6% | 1A A |
| 2009 | 20.6% | 1A A |
| 2010 | 19.3% | 1A A |
| 2011 | 19% | 1A A |
| 2012 | 18.1% | 1A A |
| 2013 | 17.8% | 1A A |
| 2014 | 16.8% | 1A A |
| 2015 | 15.1% | 1A A |
| 2016 | 15.5% | 1A A |
| 2017 | 14% | 1A A |
| 2018 | 13.7% | 1A A |
| 2019 | 20% | 1B |
| 2019 | 14% | 1A A |
| 2020 | 12.5% | 1A A |
| 2020 | 12.4% | 1C B |
| 2020 | 18.3% | 1D |
| 2021 | 11.5% | 1A A |
| 2022 | 19.3% | 1E C |
| 2022 | 11.6% | 1A A |
| 2023 | 11% | 1F A |
| 2024 | 9.9% | 1G A |
| 2024 | 14.1% | 1H |
| Year | Value | Reference/Comment |
|---|---|---|
| 2019 | 16.7% | 1A |
| 2020 | 10.77% | 1B A |
| 2020 | 15.2% | 1C |
| 2022 | 15.8% | 1D B |
| 2024 | 11.1% | 1E |
| Year | Value | Reference/Comment |
|---|---|---|
| 2019 | 23.2% | 1A |
| 2020 | 13.81% | 1B A |
| 2020 | 21.6% | 1C |
| 2022 | 22.9% | 1D B |
| 2024 | 17.1% | 1E |
| Year | Value | Reference/Comment |
|---|---|---|
| 2017 или ранее | 36.3 million | 2A A |
| 2020 | 23.3 million | 2B B |
| Year | Value | Reference/Comment |
|---|---|---|
| 2017 или ранее | 14% | 3A A |
| 2000 | 19.1% | 3B |
| 2001 | 18.7% | 3B |
| 2002 | 18.4% | 3B |
| 2003 | 17.5% | 3B |
| 2004 | 17% | 3B |
| 2005 | 16.9% | 3B |
| 2006 | 16.7% | 3B |
| 2007 | 15.4% | 3B |
| 2008 | 16.5% | 3B |
| 2009 | 16.1% | 3B |
| 2010 | 15.1% | 3B |
| 2011 | 14.8% | 3B |
| 2012 | 14.2% | 3B |
| 2013 | 13.7% | 3B |
| 2014 | 12.9% | 3B |
| 2015 | 11.4% | 3B |
| 2016 | 11.8% | 3B |
| 2017 | 10.5% | 3B |
| 2018 | 10.3% | 3B |
| 2019 | 10.9% | 3B |
| 2020 | 9.4% | 3B |
| 2020 | 10.01% | 3C B |
| 2021 | 8.8% | 3B |
| 2022 | 8.9% | 3B |
| 2023 | 8% | 3B |
| 2024 | 7.4% | 3B |
| Year | Value | Reference/Comment |
|---|---|---|
| 2017 или ранее | 12.2% | 3A A |
| 2000 | 17.3% | 3B |
| 2001 | 17.1% | 3B |
| 2002 | 16.5% | 3B |
| 2003 | 15.7% | 3B |
| 2004 | 15.1% | 3B |
| 2005 | 14.9% | 3B |
| 2006 | 14.5% | 3B |
| 2007 | 13.7% | 3B |
| 2008 | 15.1% | 3B |
| 2009 | 14.4% | 3B |
| 2010 | 13.6% | 3B |
| 2011 | 13.3% | 3B |
| 2012 | 12.5% | 3B |
| 2013 | 11.9% | 3B |
| 2014 | 11.8% | 3B |
| 2015 | 10.7% | 3B |
| 2016 | 10.5% | 3B |
| 2017 | 9.5% | 3B |
| 2018 | 9.1% | 3B |
| 2019 | 10% | 3B |
| 2020 | 8.6% | 3B |
| 2020 | 8.44% | 3C B |
| 2021 | 8% | 3B |
| 2022 | 7.9% | 3B |
| 2023 | 6.9% | 3B |
| 2024 | 6.3% | 3B |
| Year | Value | Reference/Comment |
|---|---|---|
| 2017 или ранее | 15.8% | 3A A |
| 2000 | 21.2% | 3B |
| 2001 | 20.3% | 3B |
| 2002 | 20.5% | 3B |
| 2003 | 19.4% | 3B |
| 2004 | 19% | 3B |
| 2005 | 19.1% | 3B |
| 2006 | 19% | 3B |
| 2007 | 17.1% | 3B |
| 2008 | 17.9% | 3B |
| 2009 | 17.9% | 3B |
| 2010 | 16.7% | 3B |
| 2011 | 16.4% | 3B |
| 2012 | 15.9% | 3B |
| 2013 | 15.6% | 3B |
| 2014 | 14% | 3B |
| 2015 | 12.2% | 3B |
| 2016 | 13.2% | 3B |
| 2017 | 11.5% | 3B |
| 2018 | 11.5% | 3B |
| 2019 | 11.7% | 3B |
| 2020 | 10.3% | 3B |
| 2020 | 10.07% | 3C B |
| 2021 | 9.7% | 3B |
| 2022 | 9.9% | 3B |
| 2023 | 9.1% | 3B |
| 2024 | 8.5% | 3B |
| Year | Value | Reference/Comment |
|---|---|---|
| 2016 | 492,438 | 1A |
| 2021 | 360,370 | 1B A |
| Year | Value | Reference/Comment |
|---|---|---|
| 2016 | 221,636 | 1A |
| 2021 | 143,383 | 1B A |
| Year | Value | Reference/Comment |
|---|---|---|
| 2016 | 270,802 | 1A |
| 2021 | 216,986 | 1B A |
| Year | Value | Reference/Comment |
|---|---|---|
| 2016 | 17.9% | 1A |
| 2021 | 10.38% | 1B A |
| Year | Value | Reference/Comment |
|---|---|---|
| 2016 | 16.2% | 1A |
| 2021 | 8.7% | 1B A |
| Year | Value | Reference/Comment |
|---|---|---|
| 2016 | 19.3% | 1A |
| 2021 | 11.9% | 1B A |
Cigarette smoking has been falling in the US for many years including among young people. When vaping products began to appear on the market, it was inevitable that …
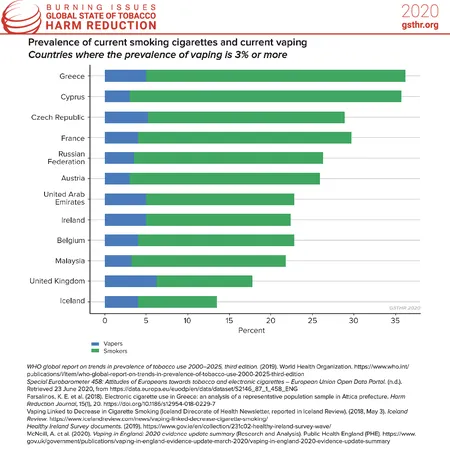
Overall, as a percentage of the total adult population, current use of vaping devices in different countries ranges between 1% and 7%. As shown by this graphic there …
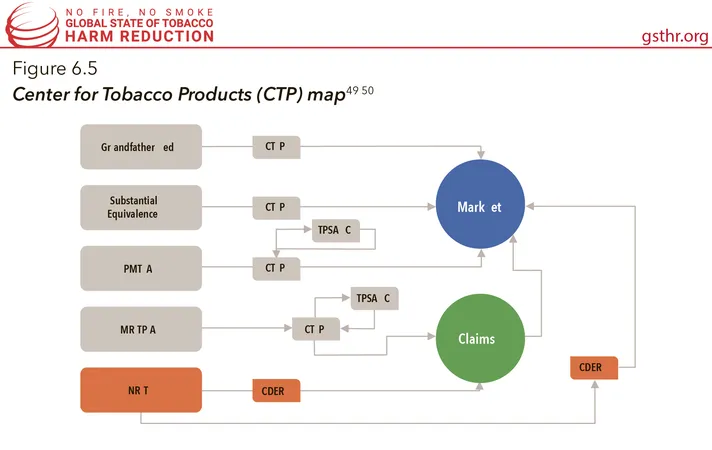
The FDA in the USA has long held the authority to regulate nicotine replacement therapies such as gum, patch, and lozenges through the Center for Drug Evaluation and …